
Written by:
Sandro Kriesch
ARCAS Managing Director, Head of ILS
Sacha Collinson
ARCAS Analyst
Executive Summary
California’s growing wildfire exposure, coupled with investor demand for diversification and advances in risk modelling, has driven the rapid maturation of the wildfire catastrophe bond (cat bond) market. Since the inaugural USD 200 million issuance in 2018, the segment has expanded significantly—by 2025, wildfire-linked cat bonds represent record issuance volumes and have become a mainstream component of insurance-linked securities (ILS) portfolios.
Introduction
California’s escalating wildfire losses over the past several years have given rise to a niche but growing segment of the catastrophe bond (cat bond) market. These insurance-linked securities (ILS) transfer wildfire risk to capital markets, providing critical reinsurance capacity for insurers and utilities when traditional coverage becomes costly or scarce. This article examines the trends in wildfire-exposed cat bond issuance since 2017, the evolution of pricing and spreads, notable bond triggers from major fires, and how recent events – including the Palisades and Eaton (Easton) fires of early 2025 – have influenced market appetite and pricing. We also highlight the latest wildfire catastrophe risk models from Verisk (AIR Worldwide) and RMS (Moody’s) that are underpinning these transactions. The analysis draws heavily on data and
reporting from Artemis.bm, a leading ILS industry source, supplemented by other industry insights. Scrutiny was nevertheless put into the analysis of the data underlying the chart.
Growth in Wildfire-Exposed Cat Bond Issuance (2017–2025)1
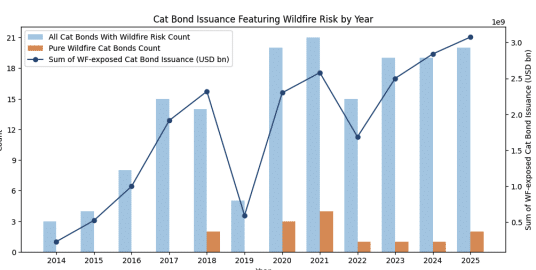
The chart above reflects at Bonds issued from 2014 to 2025 with underlying risk exposure to wildfires. This illustrates the rising number and volume of catastrophe bonds featuring California wildfire risk by year. Blue bars indicate the count of cat bonds issued with wildfire as a covered peril, orange bars show pure wildfire-only cat bond issuance count, and the blue line tracks total notional volume of wildfire-exposed cat bonds each year. Post-2017 issuance surged, reaching a new peak in 2025 (year-to-date) with over USD 3 bn of wildfire-exposed cat bonds issued. Data covers Cat Bonds from 2014-2025 (as of November 2025) sourced from the Artemis Deal Directory [1]
The California wildfire peril was virtually absent from the cat bond market until the late 2010s. After severe fires in 2017 (e.g. Tubbs Fire and Thomas Fire), the first wildfire-focused cat bond emerged in 2018. PG&E Corporation, facing enormous liability exposure from wildfires, sponsored the landmark USD200 m Cal Phoenix Re (Series 2018-1) deal – the market’s first pure wildfire cat bond[2]. This transaction provided PG&E with three-year indemnity coverage for third-party property damages caused by wildfires linked to its infrastructure. Notably, the Cal Phoenix Re bond was triggered and paid out in full after the devastating 2018 Camp Fire (which destroyed the town of Paradise, CA), making it a total loss for investors[3].
Other California utilities followed suit. In 2018, Sempra Energy (parent of San Diego Gas & Electric) issued a USD125 m SD Re 2018-1 cat bond covering wildfire liability, and in late 2020 Sempra returned with a USD95 m SD Re 2020-1 bond[4]. The Los Angeles Department of Water & Power (LADWP) even pioneered a parametric trigger structure, obtaining a USD50 m parametric wildfire cat bond (Power Protective Re 2020-1) to cover LA-area wildfire risk[5]. Insurers with heavy California exposure also turned to ILS: for example, Mercury Insurance quietly sponsored a USD50.7 m private cat bond (Randolph Re 2021-1) to reinsure wildfire losses[6]. Each of these deals helped prove the concept that capital markets can shoulder wildfire risk – a peril that traditional reinsurers were increasingly wary of as fires grew in frequency and severity.
1. Issuance volume has accelerated dramatically.
Before 2018, wildfire was at best a minor component in multi-peril cat bonds; by contrast, in 2021 alone Artemis tracked three pure wildfire cat bonds (including the Mercury deal), albeit at relatively modest aggregate size[7]. The real inflection has come in the last two years. 2024 saw about USD2.84 bn of cat bonds issued with exposure to wildfire peril – the highest annual total up to that point[8]. Now 2025 is on track to shatter that record, with over USD3.1 bn of wildfire-exposed cat bond issuance (our data) in the first eleven months of 2025. Artemis reports that this 2025 year-to-date total already exceeds any prior full-year, signaling unprecedented capacity flowing into wildfire risk[9]. Notably, 2025 has seen three separate 144A wildfire-only cat bonds (totaling USD350m) – more pure wildfire deals in a single year than ever before[10]. This reflects growing sponsor demand (from both insurers and utilities) and increasing investor comfort in structuring wildfire deals.
The drivers of this growth are twofold. First, California’s insurance market stress has made alternative capital essential – after back-to-back severe fire seasons, wildfire reinsurance became prohibitively expensive for many carriers and utilities, forcing them to seek capital markets solutions[11]. Second, investor confidence in modeling wildfire risk has improved (as discussed later), making ILS funds more willing to assume this once-untouchable peril. The end result is that wildfire-exposed cat bonds, while still a niche, now represent a record level of risk capital in the cat bond market in 2025[12]. Where wildfire coverage used to be a rarity, it is increasingly common to see new cat bond deals include California wildfire risk either on a multi-peril basis or even standalone.
2. Evolving Pricing and Risk Spreads for Wildfire Cat Bonds
Cat bond investors have historically demanded high risk premiums for wildfire risk, especially in the early deals where uncertainty was greatest. Over time, as more data became available and models improved, pricing has evolved – though wildfire cat bonds still pay considerably higher spreads relative to expected loss than more modeled perils like hurricanes see below chart.
- 2018 – First Wildfire Bonds: The inaugural PG&E cat bond in 2018 had a modelled expected loss of ~1.0%, yet it was marketed with a coupon spread in the 6%–6.5% range, and ultimately priced at about 7.5% (after investor pushback increased the pricing by ~20%)[13][14]. This implied a risk spread multiple of roughly 7.5 times the expected loss – a sizable premium reflecting investor concern about unmodeled legal/liability risks. Likewise, Sempra’s 2018 SD Re deal (covering a very high attachment point) carried an even more extreme multiple: it had an expected loss of just 0.21% (a remote 1-in-476 year probability) but priced at 4% coupon[15][16]. That is almost a 19x multiple, underscoring how cautious investors were in the face of potential litigation and clustering risks from wildfires and growing modelling uncertainty (especially for wildfire risk).
- 2020 – Adjusting After Losses: By 2020, some of the uncertainty had begun to abate (and unfortunately, real loss experience had accrued from the 2017– 2019 fires). Sempra’s second tranche, SD Re 2020-1, sat lower in the risk tower (attaching at USD1 bn) and carried a 1.5%–1.8% expected loss (average to high hazard level being the difference), significantly higher risk than their 2018 bond[17]. Investors demanded a commensurately higher yield – initial guidance was ~9.5%–10% yield, and the deal ultimately upsized and cleared at 9.75% coupon[18][19]. This equates to roughly a 6x multiple, much more in line with other cat bond perils at the time. The narrowing of the multiple (from ~19x to ~6x) suggests that as investors got more comfortable with wildfire risk (and perhaps as modeling improved over time), pricing became somewhat more efficient, though still on the higher end of the cat bond spectrum.
- 2023–2025 – Recent Deals: In the hard market of 2023–2024, cat bond spreads in general have risen, and wildfire deals continue to carry hefty premiums. A notable recent transaction is Mercury Insurance’s first public cat bond, Luca Re 2025-1, which closed in mid-2025. This deal provides USD150 m of per-occurrence cover for California wildfire (and fire-following earthquake) on Mercury’s home insurance book. It came with an expected loss of 1.08% and was initially marketed at 7.25%–7.75% spread[20]. Strong investor demand enabled Mercury not only to upsize the bond by 50% (from USD100m to USD150m) but also to price at the low end of guidance, 7.25%[21][22]. Even at 7.25%, the risk spread multiple is ~6.7x – still a sizeable premium for wildfire risk, but notably tighter than PG&E’s first deal (which was similar expected loss but paid ~7.5%). Mercury’s successful placement at the tight end of guidance, in the immediate aftermath of record California fires, was a strong indication that investors have grown more comfortable with well-structured wildfire cat bonds[23]. Yet – in hindsight – it may have been a mere sign of a softening, especially painful for wildfire, a peril with loss potential, the industry was yet to be surprised!
In summary, early wildfire cat bonds priced at extraordinary multiples of expected loss to entice investors. Since then, the pricing has moderated slightly – in part due to better data and modeling – but remains elevated relative to many other perils. Deals in 2025 are clearing with spreads in the high-single digits for ~1% expected loss layers (i.e. ~6–8x multiples), whereas in more established perils like U.S. wind, multiples are often closer to 2–4x. This gap reflects the lingering uncertainty and tail risk of wildfires, but the trajectory shows gradual normalization.
Investor-required spreads also respond to market conditions: after heavy catastrophe losses and higher interest rates in 2022–2023, cat bond yields rose broadly, which likely helped entice capital into even challenging classes like wildfire in 2024–2025. The fact that multiple new wildfire bonds have priced at or below initial guidance during 2025 indicates improving market confidence and competition for these diversifying risks[22].
Spread multiples of wildfire and hurricane bonds (2014–2025)

The chart above shows for each year, the average of all multiples (spread divided by expected loss) per issue tranche for bonds with WF exposure and bonds with HU exposure bonds. NB we only look at the issuance spread and EL, i.e. no secondary yield influence or EL effects from resetting is taken into account. While this will of course lead to some bonds being counted in both samples, it shows 1) a remarkable difference in multiple and 2) a remarkable trend that saw a break after 2023. Today – after a hard market phase and a model adjustment both bond types show comparable multiples. Also note that we do not have information on Mercury´s Randolph Re 2024-1 expected loss or spread. Thus the 2024 data point misses the influence of this pure wildfire bond. Data covers Cat Bonds from 2014-2025 (as of November 2025) sourced from the Artemis Deal Directory [1]
3. Major Wildfire Events and Cat Bond Impacts (2017–2025)
California’s wildfire history since 2017 has been brutal, with several recordbreaking fire seasons. These events have not only stress-tested insurers and utilities, but also the cat bonds designed to cover wildfire losses. Below we discuss key wildfire disasters, any cat bond triggers or losses associated with them, and how each influenced market appetite and pricing.
- 2017: A series of catastrophic fires swept California, most notably the October 2017 Wine Country fires (Tubbs, Atlas, Nuns, etc.) in Northern California and the December Thomas Fire in Southern California. These caused tens of billions in insured losses and massive liability for utility companies. In the aftermath, traditional wildfire liability insurance for utilities became extremely costly or unavailable. For example, Southern California Edison (SCE) faced USD2.2 bn in subrogation claims from the 2018 Woolsey Fire (which it settled) and over USD1.16 bn from 2017 fire lawsuits[24]. Insurers also paid out heavily for home losses. This crisis catalyzed the first wildfire cat bonds in 2018 as companies sought alternative protection[2].
- 2018: Unfortunately, 2018 brought an even worse disaster – the Camp Fire in November 2018, which virtually destroyed the town of Paradise and caused an USD~USD16–USD18 bn insured loss. Critically, investigators determined that PG&E’s equipment ignited the Camp Fire, directly triggering PG&E’s Cal Phoenix Re cat bond[3]. The USD200 m cat bond was rendered a total loss, paying out fully to cover PG&E’s third-party liability for the fire[25]. This marked the first-ever complete loss of a wildfire cat bond, and at the time it cast a pall over the nascent sector – emphasizing the real correlation and severity of California wildfire risk. Investors saw that a supposedly ~1% annual probability event had occurred within months of issuance, reinforcing a cautious approach in subsequent deals. (It’s worth noting that PG&E’s bankruptcy and the establishment of a state Wildfire Fund changed how future utility liabilities would be handled, limiting direct repeat of that scenario for bondholders.)
- 2019–2020: These years saw major fire activity (2018 and 2020 in particular were some of the largest burn years on record), but the insured losses, while high, did not produce headline cat bond triggers. For instance, 2020’s Lightning Complex fires and others caused widespread damage, but much of the loss was retained by primary insurers or state pools. However, multiple smaller wildfire events can erode aggregate cat bonds. Artemis noted that beyond single-event bonds, some aggregate cat bond deals accumulated wildfire losses in 2020–2021, eating into retentions and highlighting the peril’s attritional impact[26]. Late 2020 did see innovation with LADWP’s parametric bond, which fortunately was not triggered (it was structured around indices of fire severity). In general, after the Camp Fire, new wildfire bonds featured higher attachment points or shorter tenors to mitigate investor risk, and issuance paused in 2019 but resumed by 2020 as the need for capacity remained.
- 2021: Another bad year for fires (e.g. Dixie Fire in Northern California was the largest single wildfire in state history by area). Insurer Mercury’s 2021 private cat bond was in force and provided aggregate cover; although it wasn’t exhausted in 2021, it set a precedent for smaller regional insurers tapping the cat bond market. By 2021, three pure wildfire bonds were outstanding (PG&E’s expired after payout, but Sempra and LADWP’s remained, plus Mercury’s private bond)[7]. Investor wariness was still evident – for example, some funds reportedly marked down the value of Sempra’s 2020 bond in late 2021 as fires burned near San Diego, though ultimately that bond avoided a loss. Generally, the occurrence cat bonds (with high attachment points) were not triggered in 2021, but the systemic risk was made clear.
- 2022–2023: These years had destructive fires (such as the 2022 Mosquito Fire and others), but not on the scale of 2018 or 2020. The insurance market, however, hit a breaking point – multiple major insurers (Allstate, State Farm) began restricting new homeowner policies in California due to wildfire exposure. This increased the urgency for risk transfer solutions, including cat bonds, to help keep coverage available. By 2023, investors, armed with updated models, were increasingly open to providing wildfire capacity (albeit at a price). The outstanding cat bonds generally did not suffer principal losses in these two years, which may have also reassured the ILS community that not every fire season equals a total bond wipeout.
- Early 2025 – Palisades, Eaton (Easton) Fires: The most significant test to date came in January 2025, when extreme Santa Ana winds drove a cluster of wildfires through the Los Angeles region, notably the Palisades Fire in LA County and several others (referred to as the Eaton, Hurst, and Woodley fires). The destruction was immense – roughly 12,300 structures were damaged or destroyed[27]. Insured loss estimates initially ranged from USD15 bn to USD25 bn, making this the most costly wildfire outbreak in California’s history[28]. Some analysts even suggested losses could approach USD30 – USD40 bn, rivaling a major hurricane for the insurance industry[29][30]. Despite the severity, catastrophe bonds largely dodged catastrophic losses from these fires. However, it appears that only one cat bond was definitively triggered on an occurrence basis – a small private deal sponsored by Mercury Insurance, which suffered a loss (reports indicate Mercury recovered about USD20 m from its Randolph Re bond). A few aggregate multi-peril cat bonds saw their annual aggregates dented by the LA fires, but those impacts were limited in scale. Fitch Ratings estimated the total cat bond market loss from the 2025 LA wildfires at under USD250 m (less than 0.5% of cat bond principal)[32][33]. In other words, the ILS market emerged relatively unscathed, even from a USD20 – USD30 bn industry loss event.
The market implications of the 2025 fires were somewhat counter-intuitive. Rather than scaring investors away, the successful performance of cat bond structures under such stress actually bolstered confidence. Thus, in the months following the Palisades Fire, we saw Mercury’s oversubscribed USD150 m wildfire bond and other new issuances come to market successfully[22][37]. One could say the market “passed” the wildfire stress test, which has encouraged further growth.
In summary, each major wildfire catastrophe since 2017 has influenced the cat bond sector’s approach to this peril: higher pricing after losses, refined structures (higher attachment points, parametric triggers) after surprises, and increased utilization as necessity grew. The most recent fires in 2025 – though devastating in economic terms – demonstrated that the cat bond mechanisms can withstand even the worst-case wildfire on record with minimal principal impairment to investors[38]
4. Advances in Wildfire Risk Modeling (Verisk/AIR and RMS/Moody’s)
A critical factor enabling the growth of wildfire cat bonds has been the improvement of catastrophe risk models for wildfire. For many years, wildfire was considered poorly modeled – a “secondary peril” with significant uncertainty. The severe events of 2017– 2020 exposed gaps in the old models, as they had underpredicted the frequency of extreme urban conflagrations fueled by climate change. In response, the major modeling firms (AIR Worldwide, now part of Verisk, and RMS, now Moody’s) have significantly upgraded their U.S. wildfire models in recent releases. These advancements have given both (re)insurers and ILS investors greater confidence in quantifying wildfire risk, which directly supports more cat bond activity[39][37].
Wildfire models
Verisk (AIR) Wildfire Model: Verisk’s wildfire model for the United States was enhanced to incorporate new data from recent fires and climate impacts. In 2023, it became the first wildfire catastrophe model to complete the rigorous review by the California Department of Insurance (CDI) under a new regulatory process for rate filings[40]. This was a milestone: it meant the model met standards to be used in homeowners insurance pricing in California – a strong endorsement of its credibility. The Verisk model leverages decades of fire science and climate data to provide a forward-looking view of risk, and passing the CDI evaluation has “ushered in a new era” of data-driven wildfire risk assessment for insurers[41][42]. In practical terms, a vetted model allows insurers and cat bond sponsors to more transparently justify the risk metrics (like expected loss) used in transactions, which helps bring investors on board. California regulators’ acceptance of model output also signals that the models have significantly improved in capturing real-world wildfire behavior.
Moody’s RMS Wildfire Model v2.0: RMS (now a subsidiary of Moody’s) released a “High Definition” U.S. Wildfire Model (Version 2.0), which represents a generational leap in detail and realism. Both RMS and AIR explicitly simulate phenomena like extreme urban conflagrations, wind-driven ember travel, and the interaction of wildfires with the wildland-urban interface[43]. A key advancement is the ability to account for property-level mitigation measures and community fire defenses – for example, the model can factor in defensible space around a home or fire-hardening features, and give credit for those in risk estimates[44]. By aligning with California’s mitigation regulations and using high-resolution data, RMS v2.0 helps insurers recognize and reward wildfire resilience efforts. In August 2025, Moody’s RMS model also passed the CDI’s review process, clearing it for use in insurance rate filings[45]. The CDI’s approval of both major vendor models in 2023–2025 is a major step: it indicates these models are robust and unbiased enough to guide real underwriting decisions in California’s high-stakes market.
From an ILS perspective, the impact of better modeling is profound. Cat bond investors rely on modelled expected loss and probability metrics to price the bonds. If the models systematically underestimated wildfire risk in the past (which some sources acknowledge they did, especially regarding climate change effects)[46], investors would either avoid the risk or demand a huge cushion. Now, with updated models incorporating recent fire data and climate trends, the risk estimates are more realistic and “science-driven”, as Moody’s put it[47]. Artemis noted that advancements in wildfire cat models have been “far more effective” for ILS managers in defining their risk appetite[39]. In practice, this means investors can size positions with greater certainty, sponsors can structure triggers/attachments with more confidence, and pricing can tighten as fewer “unknown unknowns” remain. Indeed, the growing acceptance of wildfire cat bonds in 2025 is attributed in large part to enhanced modeling giving investors clarity on the peril[36][37].
In summary, Verisk’s and Moody’s latest wildfire models have significantly closed the gap between perceived and modeled risk. They incorporate modern climate data, ember spread, urban firestorm potential, and mitigation measures in ways not previously possible[43]. The timing could not be better, as California’s insurance crisis demands creative risk transfer. The cat bond market now has the analytical tools to support those solutions. As one industry commentator put it, these improvements are “supporting a more resilient insurance market and encouraging greater insurer participation” in wildfire-prone areas[48]. For cat bonds, it translates to more informed pricing and broader investor participation, which we have clearly observed in the surge of 2024–2025 wildfire-exposed deals.
5. Conclusion
The convergence of California’s urgent wildfire risk needs, investor appetite for diversifying perils, and better risk modeling has led to a maturing wildfire cat bond market. In 2018, a single USD200m deal broke the ice. By 2025, wildfire-exposed cat bonds are accounting for record issuance volumes and have become an accepted part of many ILS portfolios[10]. We have seen spreads come down from exceptionally high levels as comfort grows, though pricing remains elevated given the peril’s volatility. Crucially, the market has been tested by real catastrophes – from PG&E’s Camp Fire loss to the massive Palisades Fire event – and has demonstrated resilience, with structures largely performing as intended and investors remaining engaged[38][49].
For insurers and utilities in California, cat bond now offers a viable and in some cases cost-effective complement to traditional reinsurance[50][51]. Regulators, too, are coming on board by embracing advanced models in rate-setting, which should encourage more innovation in risk transfer. Challenges certainly remain: climate change is making wildfires more intense and less predictable, and model uncertainty isn’t entirely eliminated. Investors will rightly demand rigorous analysis and sensible deal structures (e.g. adequate attachment points, shorter risk periods, transparent triggers). But the trajectory is positive – the capital markets are increasingly stepping up to support wildfire risk transfer, bringing much-needed capacity to a peril that few others are willing to shoulder.
In a broader context, the evolution of California wildfire cat bonds is a case study in how the ILS market adapts to emerging risks. What began as a tentative experiment has, through hard-earned experience and data-driven innovation, grown into a dynamic segment that is helping to stabilize an otherwise fragile insurance market. As one Artemis report noted, 2025’s record wildfire cat bond issuance is “driven in the main by the enhanced view of the peril now available through catastrophe models, as well as improved structures and terms”, all of which increase investor comfort[52]. If current trends continue, we can expect wildfire risk to be a fixture in catastrophe bond portfolios, with ongoing refinements in pricing and coverage as the industry learns from each new fire season. In the face of a warming climate and more extreme wildfires, such capital markets solutions will be an indispensable tool for spreading risk and bolstering the resilience of California’s insurers and communities.
Disclaimer: The information provided in this article on Insurance-Linked Securities (ILS) and catastrophe (cat) bonds is for general informational purposes only. The analysis and opinions expressed herein are based on publicly available data as of the date of publication and are subject to change without notice. While we have made every effort to ensure the accuracy of the content, we do not warrant or guarantee its completeness, timeliness, or accuracy. This article is not intended as investment advice or a recommendation to buy or sell any securities. Capital is at risk. Investments carry risk, past performance may not be indicative of future results. Readers should conduct their own research and consult with a qualified financial advisor before making any investment decisions. The author(s) and publisher(s) disclaim all liability for any errors or omissions and any reliance on the information contained herein.
Sources
- Business Insurance / Reinsurance News – Coverage of 2025 Los Angeles wildfires and cat bond loss estimates[56].
- Verisk (press release) – California approval of Verisk Wildfire Model (July 2023)[40].
[1] Artemis Deal Directory
[32] California Wildfires to Result in Minimal Principal Cat Bond Losses
[46] Vendor models were seriously underestimating California wildfire risk | Insurance Insider ILS
[56] Euler ILS Partners puts wildfire industry loss at USD15bn-USD17bn …
Disclaimers
FOR INSTITUTIONAL & PROFESSIONAL CLIENTS (in the UK, EEA and Switzerland) and QUALIFIED INSTITUTIONAL BUYERS (in the USA) ONLY. FOR INTENDED AUDIENCES ONLY – NOT FOR WIDER DISTRIBUTION. THIS MATERIAL DOES NOT CONSTITUTE AN OFFER OR SOLICITATION IN ANY JURISDICTION WHERE OR TO ANY PERSON TO WHOM IT WOULD BE UNAUTHORIZED OR UNLAWFUL TO DO SO.
This information is being furnished through Acrisure Re Corporate Advisory & Solutions, LLC (“ARCAS US”) and is for informational purposes only and does not constitute an offer, invitation or recommendation to buy, sell, subscribe for or issue any securities. Securities and Investment Banking Services are offered through Acrisure Re Corporate Advisory & Solutions, LLC, Member FINRA, SIPC.
Acrisure Re Corporate Advisory & Solutions Limited (“ARCAS UK” together with ARCAS US, “ARCAS” or “we,” “us,” or “our”) and its affiliates provide the information contained in this document on an as is basis solely for the use of the intended recipient and for informational purposes only. ARCAS UK makes no representation, guarantee, or warranty, whether express or implied, including any as to the accuracy, completeness, timeliness, satisfactory quality or fitness for any particular purpose or use of any information contained in the document.
This article is intended strictly for investors who are “Eligible Counterparties” or “Professional Clients” as defined by the FCA, Institutional Investors as defined by FINRA and Qualified Institutional Buyers (QIBs) as defined in Rule 144A under the Securities Act. This presentation is not intended for any other persons and must not be distributed as such. It is the responsibility of the prospective investors to comply with all the applicable laws in their jurisdiction, including any financial services laws and regulations in their country or territory in connection with any application to participate in the opportunity described in this presentation, including obtaining any required governmental or other consent and adhering to any other formality prescribed.
The analysis and opinions expressed herein are based on publicly available data as of the date of publication and are subject to change without notice. While we have made every effort to ensure the accuracy of the content, we do not warrant or guarantee its completeness, timeliness, or accuracy. The author(s) and publisher(s) disclaim all liability for any errors or omissions and any reliance on the information contained herein.
We may have relied on data provided by an insurer, reinsurer, managing general agent, public data and other sources when preparing this information. Such information, and our related calculations, projections, forecasts and estimates, are derived from or based on sources believed by us to be reliable, but we do not guarantee the correctness or accuracy of such information, calculations, projections, forecasts or estimates. All forward-looking statements in this document are subject to various risks and uncertainties that could cause results to differ materially from expectations. Users should not place reliance on such forward-looking statements, or any other information contained herein. This article is not an offering document and does not constitute investment advice. Whilst ARCAS and its affiliates have made this presentation available to you, it is not an offer to buy or sell, or a solicitation of an offer to buy or sell any security or instrument, including but not limited to any debt or equity securities that may be issued by a special purpose vehicle.
Information contained in this article is not intended to provide, and should not be relied upon for, accounting, legal, or tax advice or investment recommendations, should the recipient require such advice it is encouraged to seek such advice independently. Information contained within the presentation does not constitute a personal recommendation as defined by the Financial Conduct Authority (“FCA”), or consider the particular investment objectives, financial situations, or needs of individual investors. You shall be responsible for evaluating the risks and merits involved in any investment described in this presentation.
Different instruments involve different levels of exposure to risk and may therefore be more or less appropriate to your circumstances, objectives or risk appetite. You should not enter into a transaction in respect of any instrument unless you are satisfied that you understand its nature and the extent of its potential risk.
We shall not be liable, under any circumstances, to any user or other person for losses of any kind (including but not limited to special, indirect, incidental, consequential, or punitive damages), or for lost profits or lost opportunities associated with this information including but not limited to the underlying data, the actuarial methods used in the analysis of the data and the resulting information. We do not accept any liability associated with the use of this information and no duty of liability is owed to any party unless agreed otherwise in writing by us.
This document and the information contained herein constitute our property, which may include trade secrets, and such document and information shall not be distributed by the recipient to any other party without our permission. Our rights in respect of this are reserved, including seeking damages for unauthorised use of the document.
Nothing in this document is intended to create any legally binding arrangements between any parties referred to herein.
Acrisure Re Corporate Advisory & Solutions Limited is a registered company in England and Wales, Company No. 13447220
Registered address: 9th Floor, 40 Leadenhall Street, London, EC3A 2BJ, United Kingdom Acrisure Re Corporate Advisory & Solutions Limited is authorised and regulated by the Financial Conduct Authority (Firm Reference Number 964339).
Acrisure Re Corporate Advisory & Solutions, LLC, Member: FINRA / SIPC. 1 Liberty Plaza, New York, NY 10006 United States. Check the background of this firm on FINRA’s Brokercheck