
Written by:
Sandro Kriesch
ARCAS Managing Director, Head of ILS
Sacha Collinson
ARCAS Analyst
The information contained herein is intended primarily for institutional investors and financial professionals. This material is not intended as a recommendation to any retail investor. Any investment decision should be made based on an investor’s individual circumstances and after consultation with appropriate professional advisers.
Note to data and analyses done in this article
All data used in this article stems from Artemis.bm with analyses performed by Acrisure Re Corporate Advisory & Solutions Limited (“ARCAS UK”). Source: Artemis.bm; data as of 30 June 2026. The regression lines, R-squared statistics, and spread multiples shown are based on a limited, non-random sample and should not be treated as predictive.
1. Issue volume, number of issues
The first half of 2026 has seen 83 new 144A cat bond issues (more than 120 tranches) with a total notional of approximately $18 billion, a new half-year record. Another two records can be noted in the first six months: 48 transactions (79 tranches) during 2Q26 and almost $7 billion of issue volume in a single month (May 2026). Spread levels for US named storm show a resistance level for the 4Q25 issues, tilting up again in 1Q26 and 2Q26 (see Chart 1). ARCAS interprets this as investors considering their portfolios to be sufficiently concentrated by now, insisting on risk-adjusted spread levels consistent with their return expectations for additional risk-taking.
2. Spread levels for US HU esposed bonds
In this section ARCAS sampled 144A Cat Bonds which are exposed to US Named storm including those which are exposed to US named storm and other perils, such as US earthquake. This may not be the most precise comparison, but – with the last damaging US earthquake being long in the past – spreads for any of those bonds will be dominated by the hurricane peril. Thus, the price changes reflected in the regression would be meaningful for US named storm.
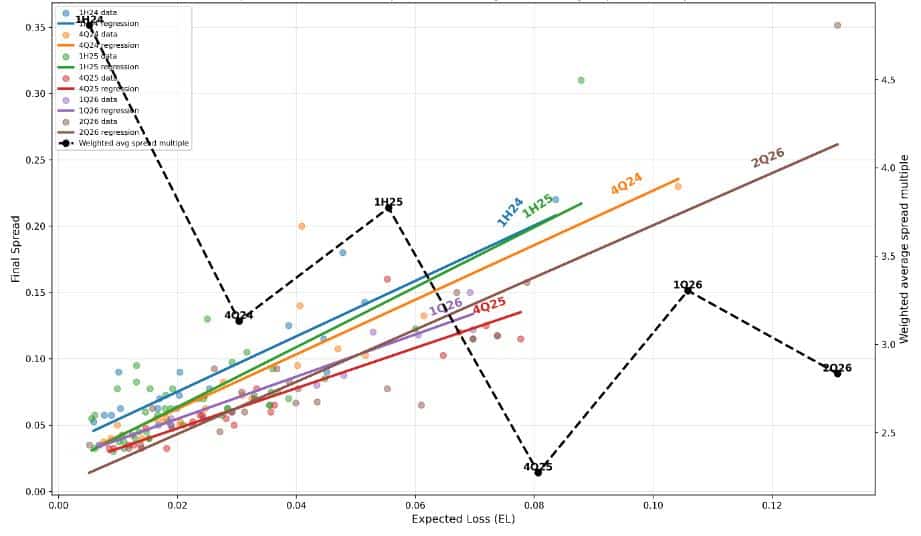
Chart 1: Regression lines of 144A Cat Bonds exposed to US named storm. Samples with different issue periods are shown. The dashed line shows the weighted spread multiple for each observed sample (the weight being the issued notional). Source: Artemis.bm; data as of 30 June 2026.
US property reinsurance markets have experienced softening in the last 24 months. ARCAS compares bonds issued from 1H24 to 2Q26, split into quarter and half year groups. As expected, and – in line with the traditional market – ARCAS see spread compression also in 144A bonds issued during this period. But it has not been a continuous softening with pricing moving up, e.g., from 4Q24 up to 1H25 and similarly again from 4Q25 to 2026, generally. One could argue that pricing has found a “resistance level,” asking a minimum price for concentration risk of US named storm. The US HU exposed bonds for 2Q26 had a regression equation of 2 times the expected loss plus 0.4% (with an R² of 80%). Another way to look at the data is the spread multiple. This ratio is an indicator of how investors are remunerated as a factor for the accepted risk. Similar to the regression development in this period, the multiples move down and up to settle at a level of around 2.8 for 2Q26. Yet, it is noteworthy, that the weighted multiple has improved from the 4Q25 levels (ca 2.3).
3. The 2Q26 US Hurricane Issues
The 144A bonds which are exposed to US hurricane (and in some cases to other perils, too), issued during the second quarter 2026, represent the last price points before the inception of the hurricane season. Chart 2 shows each bond with its expected loss and final spread, as well as the relative size represented by the bubble.
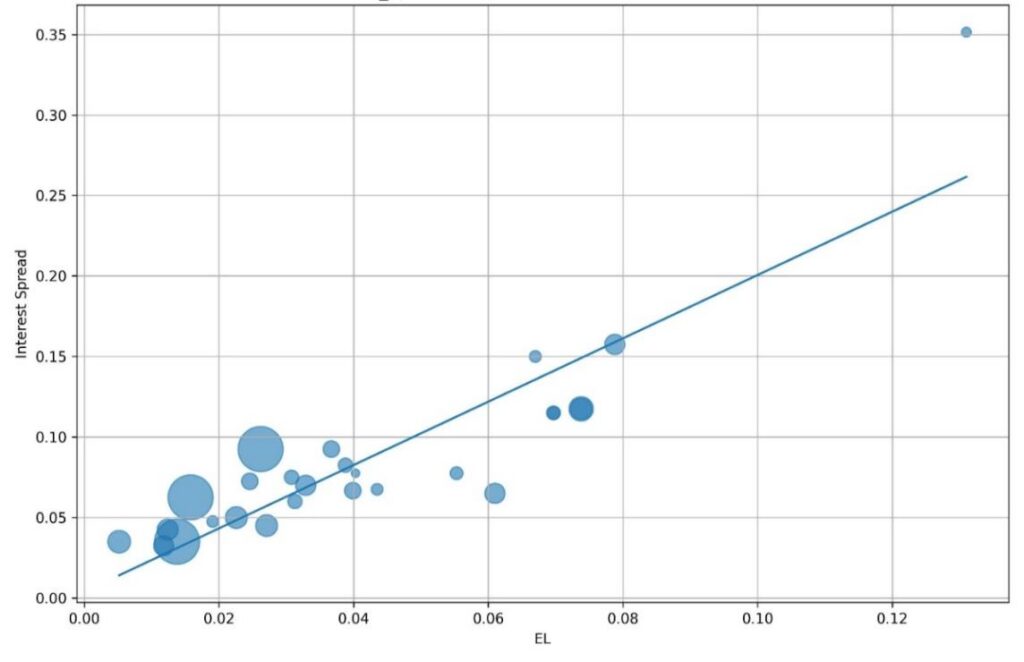
Chart 2: Regression chart of the expected loss and interest spread of 144A bonds exposed to US hurricane issued in 2Q26. The size of each point represents the final notional value. Source: Artemis.bm; data as of 30 June 2026.